
Mavix Marketing Mavix Marketing, home +1 (510) 312-5086

Free tool

Find the point where Google Ads starts paying for itself.

The ads dashboard reports revenue and calls it return. This works in gross profit, shows your break-even return on ad spend, and says whether the account is paying for itself.

  • What it is

    A calculator that follows your spend through clicks, leads and customers to gross profit after ad spend and fees.

  • What it tells you

    Cost per lead, cost per customer, return on ad spend, the break-even return at your margin, and the most you can pay per customer.

  • What you need

    Monthly spend, average cost per click, click to lead rate, lead to customer rate, order value, gross margin and any fee.

  • What to do next

    Put your real return beside the break-even one. If the gap is thin, send us the account and we will find where the spend is leaking.

What your account already reports

Landing page conversion rate, from the ads account.
If your conversions are sales rather than leads, enter 100.
This is the number that decides everything. Revenue minus cost of delivery, as a percentage.
Leave at zero to see the account performance on its own.

What the account is doing

Monthly gross profit after ad spend and fees $0
Clicks per month 0
Leads per month 0
Customers per month 0
Cost per lead $0
Cost per customer $0
Revenue generated $0
Return on ad spend 0x
Break-even ROAS at your margin 0x
Most you can pay per customer $0

How this is calculated

Clicks equals spend divided by cost per click. Leads equals clicks times the click to lead rate. Customers equals leads times the lead to customer rate. Revenue equals customers times order value, and gross profit is revenue times margin, minus spend and fees.

Break-even ROAS is one divided by your gross margin. The most you can pay per customer is order value times margin, which is the point where acquisition consumes the entire profit on the sale.

What the result means

Return on ad spend is a revenue number. This is a profit one.

A 3x return can be break-even

At a 40% gross margin, three dollars back on every dollar spent covers the media and almost nothing else. Once the management fee lands on top, the same account is losing money and still reporting a positive return.

It gives you a bidding ceiling

Once you know the most you can pay for a customer, every bid has an answer instead of an opinion. Without that ceiling you are guessing whether a $90 cost per customer is good news or the reason next quarter is thin.

It separates the account from the offer

If the sum fails at a realistic click price, the problem is the margin or the offer rather than the campaign. No amount of keyword work rescues an offer that cannot carry the cost of a click.

How realistic is the result?

This is an estimate built on the averages you type in. Real accounts vary week to week, and the tracked conversion decides what a lead even is.

What moves the real number

  • Your gross margin
  • Ad quality and relevance
  • Landing page conversion rate
  • Competition on the searches
  • Offer and pricing
  • Sales process and close rate

Where the sum flatters itself

  • Margin taken before delivery cost. If fulfilling the job eats staff time, that time belongs in the margin box or the answer is fiction.
  • A close rate quoted from memory. Nearly everyone rounds this up, and it is the input the whole result is most sensitive to.
  • A click price that holds while you scale. Spend more and you buy looser keywords, so the cost per click drifts up as volume goes up.
  • No learning period. New campaigns waste money before they work, and none of that early spend is anywhere in this model.
  • First order value in the order value box. If people buy again, this reads low. If they refund, it reads high. Use what you actually keep.

Reading the result

Four things to do with the number.

Put your real return beside the break-even one

The gap between those two rows is the entire argument. If your reported return sits under the break-even figure, the account is buying revenue with profit, and more spend makes the hole deeper rather than shallower.

Keep the fee inside the sum

Agency fees are usually reported outside the ads account, which is how a campaign looks profitable in one screen and not in the other. The fee box is here so the answer matches what actually leaves your bank.

Push the close rate before the click price

Take a point off the lead to customer rate and watch what happens. On most accounts the sales process moves the answer harder than the cost per click, and it is the half nobody is optimising.

Check the ceiling against what you pay now

The last row is the most you can pay for a customer and still break even. Pull your actual cost per customer from the last ninety days and compare. If you are above the ceiling, you already know what has to change.

Real accounts

What the same sum produced on real accounts.

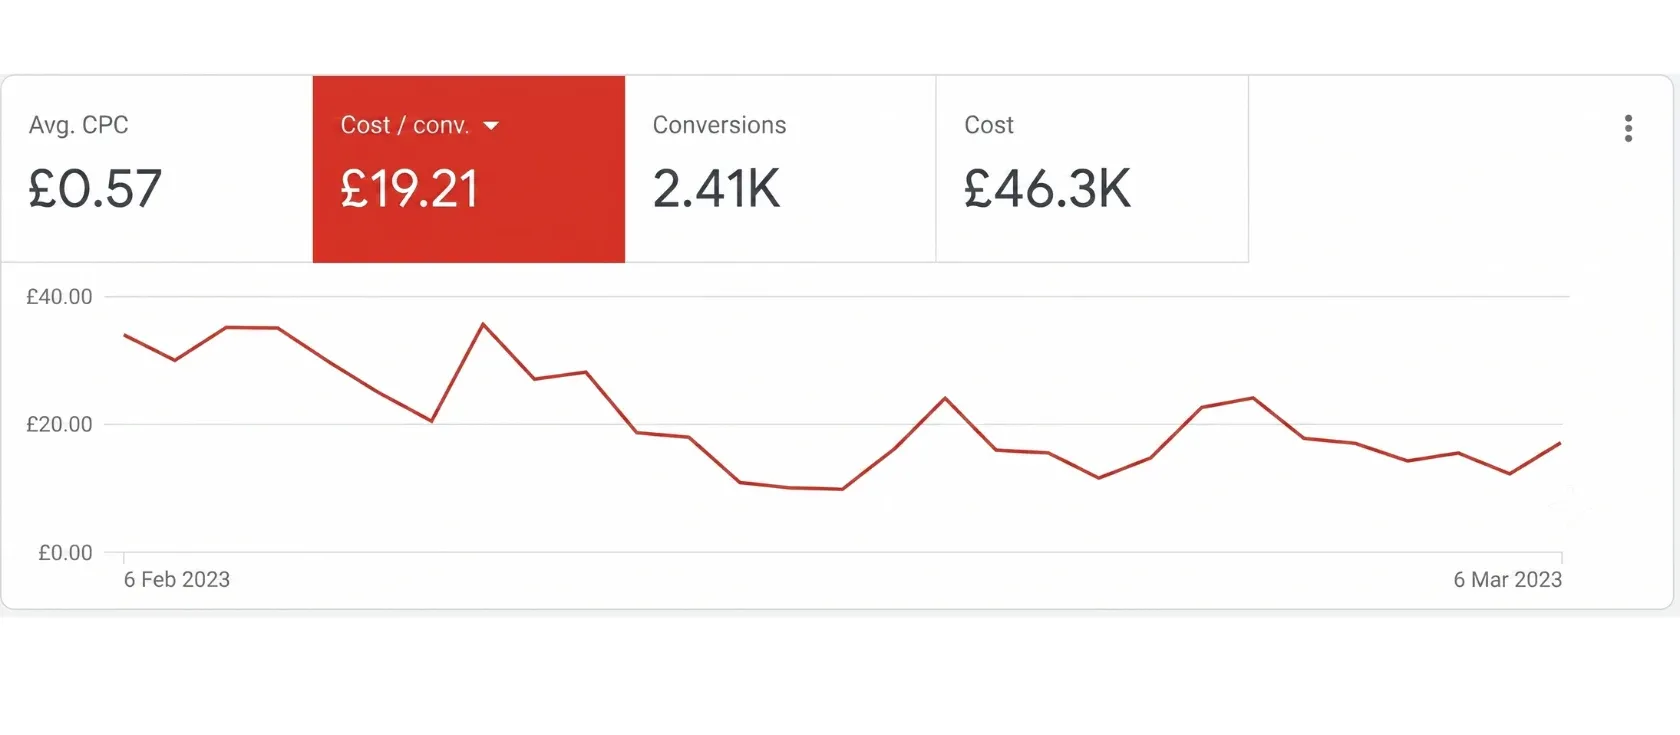
Two Google Ads accounts where the tracked number was fixed before anything was optimised. The figures are read off the accounts.
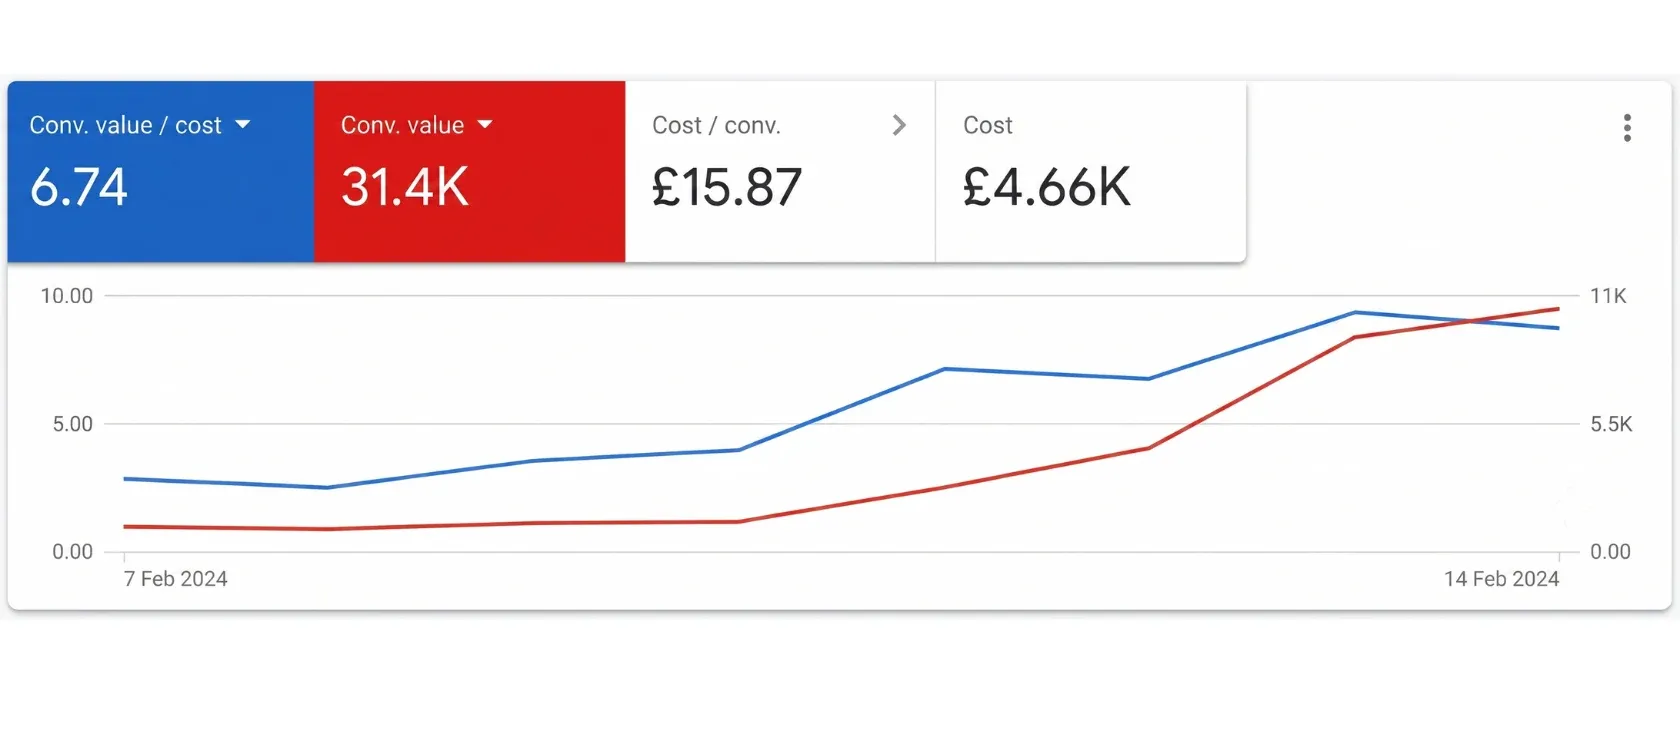
Google Ads showing 6.74 conversion value per cost and £31.4K conversion value

Google Ads, retailMedia buying

6.74xreturn on ad spend
  • £31.4Kconversion value
  • £4.66Kspend behind it
  • £15.87cost per conversion
Read from
The Google Ads account itself
Period
7 to 14 February 2024, an eight-day window
Read the full story
Google Ads showing 2.41K conversions at £19.21 each from £46.3K of spend

Google Ads, lead generationMedia buying

2.41Kconversions

  • £19.21cost per conversion
  • £0.57average cost per click
  • £46.3Kspend managed
Read from
The Google Ads account itself
Period
6 February to 6 March 2023, twenty-nine days
Read the full story

Questions

What people ask before and after using it.

01 What does the Google Ads ROI calculator work out?
Whether your ads account is making money once margin and fees are counted. You enter spend, cost per click, the click to lead rate, the lead to customer rate, order value, gross margin and any management fee. It returns clicks, leads, customers, cost per lead, cost per customer, revenue, return on ad spend, your break-even return and the most you can pay for a customer. The headline is gross profit after everything has been paid.
02 What is break-even ROAS and why does it matter?
Break-even return on ad spend is the point where the gross profit from a sale exactly covers what you paid to win it. It is set entirely by your margin, worked out as one divided by the margin. A headline return figure means nothing without the margin beside it. The same return can be profitable at one margin and loss making at a lower one, which is why the calculator shows both rows together.
03 Should I enter revenue or profit per customer?
Neither directly. The calculator asks for average order value and gross margin separately and works the profit out itself. That is deliberate, because entering revenue and treating it as profit is the single most common way this calculation misleads the person doing it. Put the order value in one box and your real margin in the other, and the sum stays honest.
04 Where do I find cost per click and click to lead rate?
Both sit in your Google Ads account. Cost per click is in the campaign overview for whatever date range you pick. The click to lead rate is your conversion rate, provided conversions are set up to count leads rather than page views. Use the last ninety days rather than last week, because a short window swings on a handful of clicks and gives you a number you cannot plan on.
05 What if my conversions are sales rather than leads?
Enter 100 in the lead to customer box, as the hint under it says. The calculator then treats every conversion as a customer, and the cost per lead and cost per customer rows match. If your conversions are leads, enter your real lead to customer rate instead. The gap between those two rows is where many lead generation accounts quietly lose money.
06 Why does the result look worse than my ads dashboard?
Usually because the dashboard reports conversions rather than customers, and revenue rather than profit. A dashboard showing a strong return on a thin margin account can be describing a loss. That is the platform reporting what it can see rather than being dishonest. This calculator adds your margin, your close rate and your management fee, which are the three things the dashboard never knows.
07 What moves the real number most?
The close rate and the margin. Take a point off the lead to customer rate and watch the profit row move further than a change in click price would. On the platform side, keyword matching and ad quality decide what a click costs and how relevant it is. The landing page decides how many clicks become leads. Competition in your category sets the floor on click price and you cannot argue it down.
08 What should I do with the result?
Put your real return beside the break-even one. If it sits under, the account is buying revenue with profit and more spend deepens the hole. Compare the most you can pay per customer with what you pay now, using the last ninety days. Then decide whether the fix is the sales process, the landing page or the keywords. Each one is a different conversation and the calculator tells you which to have.
09 Should I include the management fee?
Yes, if you want the answer to match what leaves your bank. Agency fees are reported outside the ads account, which is how a campaign looks profitable on one screen and not on the other. Leave the fee at zero to judge the account on its own, then add it back and see whether the account still clears it. Both views are useful and they answer different questions.
10 Does this replace the free ads review?
No. The calculator tells you whether the account can be profitable at your margin and click price. The review is a person looking inside the account at the searches you are matching, the landing pages and the conversion tracking. Underperforming accounts tend to lose money on searches they should never have matched, and no calculator can see those. You can request the review through the contact page.
11 Is anything I enter stored?
No. The sum runs in your browser as you type and nothing is sent to a server. No account is connected, no record is created and closing the tab discards the numbers. If you later ask for a review, you provide details through the form on the contact page, and that is the only point at which anything is kept.
12 What are the common mistakes with this calculator?
Quoting margin before delivery cost, so staff time never enters the sum. A close rate from memory, which is easy to round up. Assuming the click price holds as you spend more, when bigger budgets buy looser keywords. Ignoring the learning period, where new campaigns waste money before they work. And putting first order value in the order value box when customers buy again or refund. Use what you keep.

Next step

Is your account really paying for itself?

Send us access and we will run this sum on the real figures, with the tracking checked first, and tell you which two changes would move it.

Free, written by a person, yours to keep either way.

Free review

Send the address. We will tell you what it is costing you.

  • Search. What you rank for now, and the searches you should be winning.
  • Paid. What the spend is buying, and the campaigns quietly eating it.
  • Email. Whether the list is mailed at all, and what the missing flows are worth.
  • Tracking. Whether it measures anything real, or counts page views as sales.

The review is free, and yours to keep whether you hire us or not.

Send the site. We will say what we would fix first.

A minute to fill in. A written answer from a person, not a sequence.

Free, and yours whether you hire us or not.

Free review

A written plan for more enquiries from your site.

  • What you rank for, and what you should.
  • What the ad spend is buying, and what a lead really costs.
  • Which follow-up emails your list is missing.
  • Whether your tracking counts anything real.

Read by a person, written for your business, back within one working day. Yours to keep whether you hire us or not.

150+ businesses since 2019. No sequence, nobody chases you.

Free, and yours whether you hire us or not.

Book a call

Pick a time that suits you.

Fifteen minutes with the founder, who will have read your site before you speak.