
SEO case study · 18 September to 17 December 2024
A real estate brokerage broke out of flat search traffic in eight weeks
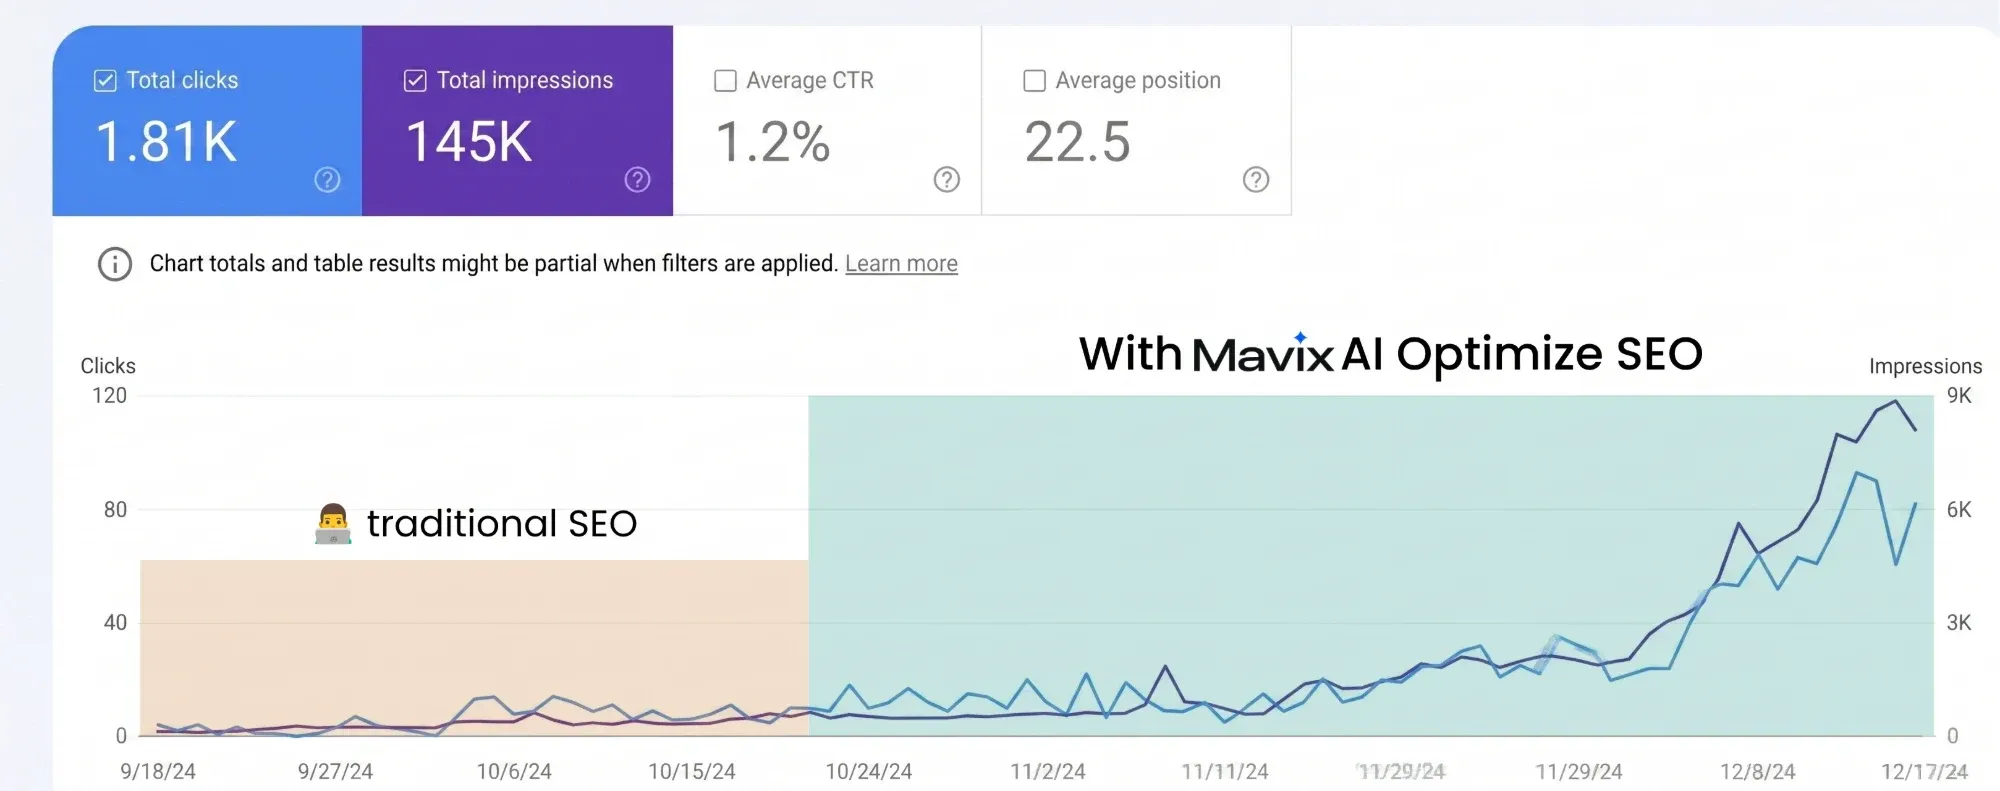
Content spend was earning nothing in a crowded market. Neighbourhood page groups went live from late October 2024, and impressions took off in December.
145K
impressions
1.2%
click-through rate
22.5
average position
Measured over
18 September to 17 December 2024
What to notice
The top row gives 1.81K clicks, 145K impressions, a 1.2% click-through rate and an average position of 22.5. Note the grey line under it saying totals may be partial. The rise starts in late November and steepens in December.
Want numbers like these?
Get a free written review of your own account.
Who the business is
A real estate brokerage working one city property market. It is not named here, so it is described by its trade and by what the chart shows.
Why marketing mattered
Buyers and sellers search by neighbourhood. A brokerage that owns the pages for its areas meets them before the portals and the larger agencies do.
- Service
- SEO
- Sector
- Real estate brokerage, SEO
- Period measured
- 18 September to 17 December 2024
- Figures from
- A Search Console performance chart for the account
What was not working
The problem
A brokerage in a crowded property market whose impressions had not moved in weeks. Money was going into content that was not earning any visibility.
- Impressions were completely flat.
- The market was crowded with larger agencies and portals.
- Content budget was being spent without any gain in visibility.
Where things stood before the work began
For the first nine weeks on the chart nothing moves. The site appears a few hundred times a day and collects a handful of clicks.
What we found, and why we started there
The thinking
General property articles were competing with the whole market. Neighbourhood searches were narrower and winnable, so Mavix used AI-assisted analysis of each area to plan groups of linked pages around them.
How we did it, step by step
- 1
Neighbourhood page groups
Linked sets of pages were built for each area the brokerage works in, from around 24 October 2024.
- 2
General articles replaced
The budget moved from broad property content to pages tied to a place.
What the numbers show
The result
1.81K
organic clicks in three months
1.81K clicks from 145K impressions at an average position of 22.5. Both lines are flat until late November 2024, then climb through December to roughly 90 clicks and 9,000 impressions a day.
From the work to the outcome
- Neighbourhood page groups
- Shown for area searches
- 145K impressions
- 1.81K clicks
How to read this, and what it does not prove
Thirteen weeks of Search Console data with a filter applied, 18 September to 17 December 2024. Read the totals as part of the account. The bands and labels on the chart were added by Mavix.
Search Console notes on this chart that totals may be partial because a filter was applied, so these figures cover part of the site or part of its searches, not all of it. Most of the growth is in the last three weeks, which is too short to call a level. Clicks are visits, not viewings or instructions. The chart is an annotated image, not the raw export, and the client is not named, so a reader cannot check it against the account. It is one account with no control group: it shows what happened after the change, and it cannot show how much of that the change caused.
Want this for your business?
It starts with a free written review.
What you can take from this
Write about places, not property in general
An article on "buying a home" competes with everyone. A page on one neighbourhood competes with a few.
New pages take weeks to show
Five weeks passed between the change and the rise. That gap is normal.
Check what a filter is hiding
A filtered chart can flatter or undersell an account. Ask which pages or searches it covers.