HVAC Google Ads by season: spend one yearly budget on the two peaks, and keep install work steady
HVAC demand peaks in July and January and drops in spring and fall. How to split a Google Ads budget by season, with EIA demand data and worked numbers.
An HVAC company should set one yearly Google Ads budget and spend it unevenly: most in the summer and winter peaks, least in spring and fall. US home electricity use in 2025 was 72 percent higher in July than in April, according to the EIA. Emergency repair campaigns should follow that curve. Install and maintenance campaigns should stay steady.
This page is for owners and managers of heating and air conditioning companies who run Google Ads and watch the budget run dry in a heat wave, then sit idle in April. It shows the demand curve, a worked yearly split, the click and lead prices, and how to move money ahead of the weather without breaking Google’s budget rules.
The short version
- US residential electricity sales in 2025 peaked at 168.5 billion kWh in July and hit a low of 97.8 billion kWh in April, per EIA Table 5.1.
- January was the second peak at 152.6 billion kWh, 56 percent above April, and that figure leaves out homes heated by gas.
- Air conditioning advertisers paid a median $9.68 a click and $127.74 a lead in LocaliQ’s 2025 home services benchmarks; heating and furnace advertisers paid $9.30 and $129.02.
- Google can spend up to 2 times your average daily budget on one day, and up to 30.4 times it in a month.
- Run emergency repair, install and maintenance as separate campaigns, and move only the emergency budget with the seasons.
When do HVAC customers search the most?
HVAC demand peaks twice a year, in July and August for cooling and in December and January for heating, with low points in April and November. The cleanest public measure is home electricity use. EIA’s Electric Power Monthly Table 5.1 shows US residential sales of 168.5 billion kWh in July 2025 against 97.8 billion kWh in April.
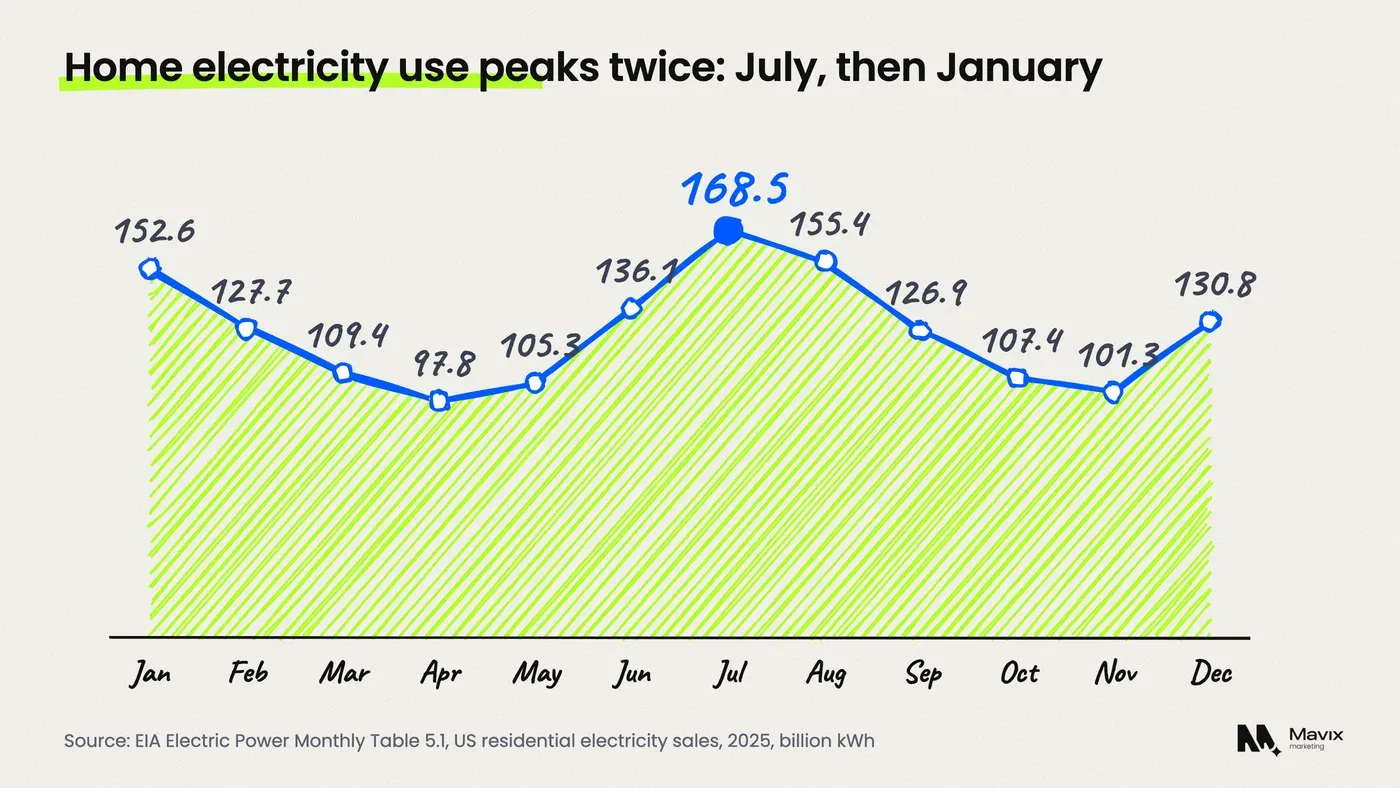
Electricity use is a stand-in for search demand, not the same thing, but it moves with the same cause: people run cooling and heating hard, and that is when systems fail. The EIA says US load is generally highest in summer and lowest in spring and autumn (EIA).
| Season (2025) | Months | Residential electricity sales | Share of the year |
|---|---|---|---|
| Winter | Dec, Jan, Feb | 411.1 billion kWh | 27.1% |
| Spring | Mar, Apr, May | 312.5 billion kWh | 20.6% |
| Summer | Jun, Jul, Aug | 460.0 billion kWh | 30.3% |
| Fall | Sep, Oct, Nov | 335.6 billion kWh | 22.1% |
The table shows a summer peak about half again as big as spring. The winter row understates heating demand, because natural gas is the most common heating fuel in US homes, the EIA says, and gas furnaces barely show up in electricity figures. A company in Minnesota will see a bigger winter peak than this; one in Phoenix or Houston will see a bigger summer one.
How should an HVAC company split a Google Ads budget by season?
Set the yearly total first, then give each season a share that matches your own call history. If you have no history yet, use the EIA seasonal shares as a starting shape. About 30 percent of the year’s demand falls in summer, 27 percent in winter, 22 percent in fall and 21 percent in spring. Apply the swing only to emergency work.
- Pull last year’s calls by month from your call tracking or phone bill. This is your real curve and beats any national figure.
- Set the yearly budget from the jobs you need and what each one costs (the next sections show the sums).
- Split it by campaign. Decide what share goes to emergency repair and what goes to install and maintenance.
- Spread the emergency share by season, using your curve or the EIA shares.
- Keep install and maintenance flat, then divide each month by 30.4 for the average daily budget Google bills against.
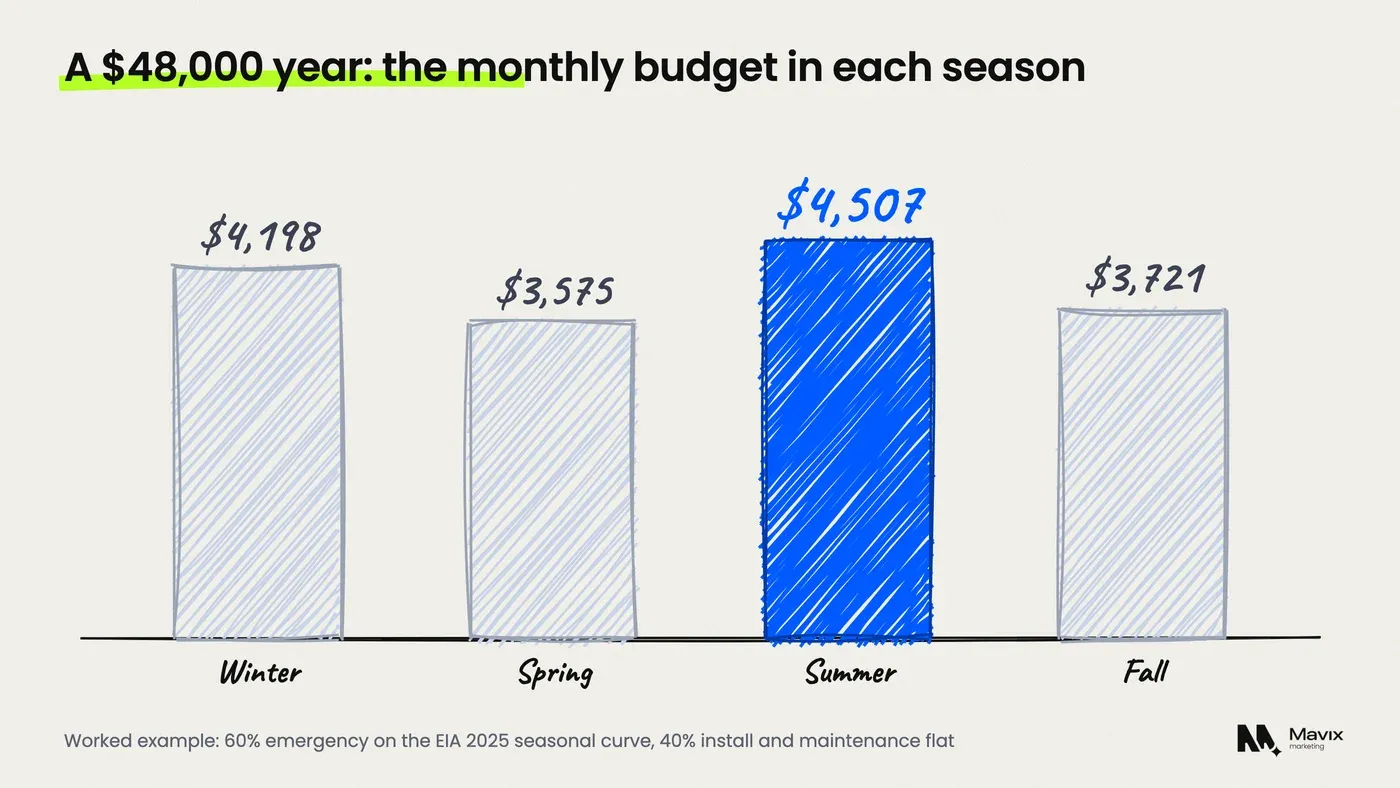
A worked example: $48,000 a year, with an assumed 60 percent ($28,800) on emergency repair and 40 percent ($19,200) on install and maintenance, which is $1,600 a month.
| Season | Emergency per month | Install and maintenance per month | Total per month | Total per day |
|---|---|---|---|---|
| Winter | $2,598 | $1,600 | $4,198 | $138 |
| Spring | $1,975 | $1,600 | $3,575 | $118 |
| Summer | $2,907 | $1,600 | $4,507 | $148 |
| Fall | $2,121 | $1,600 | $3,721 | $122 |
The emergency budget is 47 percent bigger in summer than in spring, while install money never moves. That is the point: replacement buyers compare quotes over weeks, so their searches spread out across the year far more than “AC not cooling” at 4pm in July.
Why should emergency and install work run as separate campaigns?
Because they have different buyers, different job values and different peak times, and one shared budget lets the cheap, urgent searches eat the money meant for the big jobs. A repair call books in minutes. A system replacement takes quotes and financing. Separate campaigns let you set separate budgets, hours and bids for each.
| Campaign | Example searches | When budget should peak | Usual lead | Ad hours |
|---|---|---|---|---|
| Emergency repair | ac not cooling, furnace not working, hvac repair near me | Heat waves and cold snaps | Phone call | Only when someone answers, or 24/7 if you run on-call |
| Install and replacement | new ac unit cost, heat pump installation, furnace replacement | Steady, with a lift in spring and fall | Form or call for a quote | Office hours plus evenings |
| Maintenance | ac tune up, furnace service, hvac maintenance plan | March to May and September to October | Booking form | Office hours |
The table shows why one budget fails: in July the emergency searches alone can use all of it by mid-morning, and the install campaign never shows. Our Google Ads for HVAC companies page sets out this structure, with the negative keywords that keep the campaigns from bidding on each other’s searches. The starting list of searches to block is in our post on negative keywords for home services.
What does an HVAC lead and booked job cost on Google Ads?
An HVAC lead cost a median $127.74 for air conditioning and $129.02 for heating and furnaces in LocaliQ’s 2025 benchmarks. They measured 3,211 US home services search campaigns from April 2024 to March 2025 (LocaliQ). If half your leads book, a booked job costs about $255 to $258.
| LocaliQ category | Cost per click | Click-through rate | Conversion rate | Cost per lead |
|---|---|---|---|---|
| Air conditioning install and repair | $9.68 | 6.43% | 6.56% | $127.74 |
| Heating and furnaces | $9.30 | 5.97% | 7.48% | $129.02 |
| All home services | $7.85 | 6.37% | 7.33% | $90.92 |
HVAC leads cost about 40 percent more than the home services median. The figures are medians across a full year, so they hide the seasonal swing, and LocaliQ does not break them out by month. For more HVAC numbers with their sources, see HVAC marketing statistics for 2026.
The job value decides which campaign can pay those prices. Two illustrations, with assumed figures you should replace with your own invoices:
- A $400 repair at 50 percent gross margin leaves $200. Spend half on winning it, book half your leads, convert 6.56 percent of clicks: the most you can pay is $3.28 a click. Repairs alone rarely pay at a $9.68 median.
- An $8,000 replacement at 30 percent margin leaves $2,400. Spend half, book one lead in four: you can pay $300 a lead, or $19.68 a click.
That is why the install campaign gets protected money. Repairs still earn their place when a repair customer joins a maintenance plan or comes back for the replacement, so count repeat work from your own records. The same arithmetic, worked for a plumbing company, is in how much a plumber should spend on Google Ads.
How do you raise the budget before a heat wave or cold snap?
Raise the emergency campaign’s daily budget a day or two before the forecast turns, and bring it back once the weather breaks. Google already lets a campaign spend up to 2 times its average daily budget on a busy day. It never allows more than 30.4 times the daily budget in a month (Google Ads Help).
Three tools, and when each one fits:
- A higher daily budget. The simple lever. Use it for a forecast that lasts a week or more.
- A seasonality adjustment. This tells Smart Bidding (Google’s automated bidding) to expect a jump in conversion rate. Google says it suits short events of 1 to 7 days. It works only with Target CPA and Target ROAS on Search, and should be used only when you expect a major change (Google Ads Help). A two-day freeze can qualify; a whole summer cannot.
- An ad schedule. Limit ads to the hours your phones are answered. Google says a scheduled campaign still paces toward 30.4 times the daily budget in a month (Google Ads Help), so fewer hours means more spend in each one.
Raise the budget for the weather you can see coming, not for the month on the calendar.
Do not raise the budget if your dispatcher is already booked out. More calls you cannot serve still cost the full click price, and the callers go to a competitor anyway.
What should an HVAC company do with Google Ads in spring and fall?
Spend the quiet months on maintenance and planned replacements. ENERGY STAR tells homeowners to check the cooling system in spring and the heating system in fall (ENERGY STAR), so tune-up and maintenance plan searches rise just as emergency calls fall. Those customers fill the schedule and become next summer’s repair and replacement work.
Spring and fall are also the time to fix the account, not just to cut it. Review the search terms report, rebuild ads and pages for the install campaign, and check that calls are counted as conversions. If clicks were coming in all summer with few calls, work through why Google Ads clicks turn into no leads before the next peak.
Local Services Ads, Google’s pay-per-lead ads that show above search ads, fit here too. You set an average weekly budget. Google can go over it in a given week but never over the monthly maximum. A missed call during business hours is charged if the caller stays on for more than 20 seconds (Local Services Help). Our comparison of Local Services Ads and Google Ads covers which one is cheaper for a home service business.
When seasonal budgeting does not work
Shifting money by season only helps if the rest of the account can turn clicks into booked jobs. These are the usual reasons it fails:
- No call tracking. Without calls counted as conversions, you cannot see which months or campaigns book jobs, and you are guessing the curve.
- The national curve, used blindly. Climate decides the shape. A heating-heavy northern market and a cooling-heavy southern one need different splits. Use your own calls once you have a year of them.
- No staff for the peak. Ads that run when the phones go to voicemail buy calls for your competitors.
- Cutting to zero in the quiet months. A paused account loses the maintenance and replacement buyers who search in spring and fall.
A strong Google Business Profile also wins calls at every season without a click price. The local SEO for HVAC companies page covers that side.
Questions people ask about HVAC Google Ads budgets
How much should an HVAC company spend on Google Ads a month?
Enough to buy the booked jobs you need at a cost per job your margin carries. At LocaliQ’s 2025 median of $127.74 a lead and half of leads booking, each job costs about $255, so 15 extra jobs a month needs about $3,830. Then spread that across the year unevenly, with more in the summer and winter peaks.
Should HVAC companies stop Google Ads in the off season?
No. Cut the emergency budget, but keep install and maintenance campaigns running. ENERGY STAR tells homeowners to service cooling in spring and heating in fall, so those are the months maintenance plan and replacement buyers search. A paused account also has no recent data, which makes the next peak harder for Smart Bidding to price.
Do HVAC clicks cost more in summer?
LocaliQ’s benchmarks do not report a monthly split, so there is no public figure to quote. What you can check is your own account: the auction insights and cost per click by month show whether competitors push prices up in a heat wave. Plan for higher spend in peaks because of more searches, whatever the click price does.
How much budget should go to emergency repair versus installs?
There is no standard split. Start from job value: a high-margin replacement can carry a far higher cost per lead than a repair, so protect its budget first. The worked example on this page assumed 60 percent emergency and 40 percent install and maintenance. Move the split once your tracking shows which campaign books jobs at a profit.
Is Google Ads or Local Services Ads better for HVAC?
Most HVAC companies do best running both and comparing cost per booked job, not cost per lead. Local Services Ads charge per lead with a weekly budget and show above search ads. Google Ads gives more control over keywords, hours and landing pages, which matters most for install and replacement work where the job value is high.
How fast should I raise the budget when a heat wave is forecast?
A day or two before the heat arrives, so the campaign is not limited when the calls start. Google can already spend up to 2 times the daily budget on a busy day, which covers a single hot afternoon. For a week of extreme weather, raise the daily budget itself, and lower it again once the forecast breaks.
The bottom line
Decide the year, not the month. Set one yearly budget and give the emergency campaign a seasonal curve from your own calls. Keep install and maintenance money steady. Raise spend ahead of the weather only when you have the crew to answer. If you cannot yet say what a booked job costs you, fix the tracking before you move a single dollar.
If your HVAC budget runs out in July and sits unspent in April, get your HVAC Google Ads account checked for free. You get a written seasonal budget plan and a list of what is wasting money, usually within one working day.
Free review
Want this looked at on your own site?
Send the address. A person reads it and writes back with the two or three things that would move your enquiry number first. Free, and yours to keep whether you hire us or not.