
SEO case study · The chart runs from 2016 to September 2022
A financial advisory firm went from no search traffic to about 8,000 visits a month
Three years of flat search traffic ended when the firm stopped chasing the big finance terms and built depth on the subjects it knows. The growth took three more years to arrive in full.
Near zero
estimated visits a month before 2019
2019
work began
Sept 2022
date of the peak shown
Measured over
The chart runs from 2016 to September 2022
What to notice
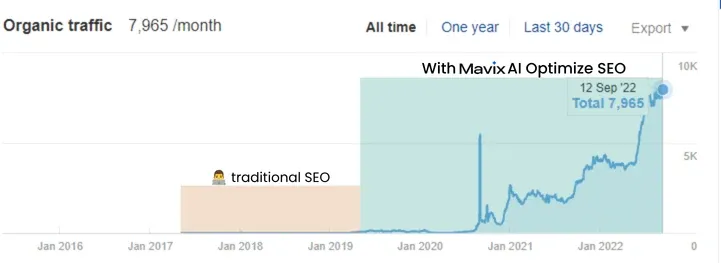
The marker at the top right reads 7,965 on 12 September 2022. The line is flat to 2019, has one tall spike in late 2020, then climbs in stages through 2021 and 2022.
Want numbers like these?
Get a free written review of your own account.
Who the business is
A financial advisory and wealth management firm. It is not named here, so it is described by its trade and by what the chart shows.
Why marketing mattered
People choose a financial adviser slowly and read a lot first. A firm whose own pages answer those questions is trusted before the first meeting.
- Service
- SEO
- Sector
- Financial advisory firm, SEO
- Period measured
- The chart runs from 2016 to September 2022
- Figures from
- Ahrefs
What was not working
The problem
A financial advisory firm whose search traffic had been close to zero for years. Large banks and financial publishers held every search worth having.
- Search traffic had been close to zero for about three years.
- Banks and large financial publishers held the main searches.
- Earlier search work had produced no visible change.
Where things stood before the work began
From 2016 to the end of 2018 the line on the chart cannot be told apart from the axis. In search terms the firm did not exist.
What we found, and why we started there
The thinking
A small firm cannot outrank a bank on "financial adviser". It can become the most thorough source on a narrower set of subjects. Mavix used AI-assisted research to map those subjects and built the site out to cover them fully.
How we did it, step by step
- 1
Depth on the subjects the firm advises on
The site was built out topic by topic from early 2019, so each subject was covered more fully than the larger sites bothered to.
- 2
Kept up for years
The growth on the chart comes from 2020 to 2022. The work that produced it started well before.
What the numbers show
The result
7,965
estimated organic visits a month
An estimated 7,965 organic visits a month on 12 September 2022, from a line that sat near zero until 2019. The climb begins in 2020, passes 4,000 in 2021 and accelerates through 2022.
From the work to the outcome
- Depth on a few subjects
- Rankings the big sites left open
- Steady climb from 2020
- About 7,965 estimated visits a month
How to read this, and what it does not prove
An Ahrefs estimate of monthly organic visits, not a count from the firm’s own analytics. The peak is from September 2022. The bands and labels on the chart were added by Mavix.
This is an Ahrefs estimate, not measured traffic. Ahrefs works it out from the rankings it can see, and it can sit well above or below what analytics records. The tall spike in late 2020 is a single moment, not a level. The chart ends in 2022, so it says nothing about today. The chart is an annotated image, not the raw export, and the client is not named, so a reader cannot check it against the account. It is one account with no control group: it shows what happened after the change, and it cannot show how much of that the change caused.
Want this for your business?
It starts with a free written review.
What you can take from this
Narrow beats broad against big brands
Pick the subjects where a specialist can be more useful than a bank, and cover them completely.
Budget in years for finance
This chart needed about three years to show its full result. Finance is slow because trust is slow.
Treat tool estimates as estimates
Ahrefs is good for the shape of a trend. Use analytics for the real number.