
Roofing marketing statistics for 2026, each with its source
29 US roofing marketing statistics for 2026: jobs, review habits, Google Ads costs, hail and storm claims, each linked to the source it came from.
Three numbers frame roofing marketing in the US in 2026. The trade employed 166,900 roofers in 2025 (BLS). A roofing lead from search ads cost a median $228.15 (LocaliQ). And wind and hail caused 42.5 percent of homeowners insurance losses in 2023 (Triple-I).
Every figure on this page was opened at its publisher and checked before it was used. Each one carries its year, its geography and what it measures. Where a number covers home services or local businesses in general, the row says so.
The short version
- The US had 166,900 roofers in 2025, and 20 percent of them were self-employed, according to the BLS Occupational Outlook Handbook.
- In the BrightLocal 2026 survey of 1,002 US adults, 97 percent read reviews for local businesses and 68 percent require four or more stars.
- Roofing and gutter advertisers paid a median $228.15 a lead in the LocaliQ 2025 benchmarks, the highest of 16 home services categories.
- The roofing and gutters conversion rate was a median 3.70 percent, about half the 7.33 percent median for home services overall.
- NOAA counted 27 billion-dollar weather and climate disasters in the US in 2024, and 17 of them were severe storms.
- Wind and hail made up 42.5 percent of US homeowners insurance losses in 2023, according to Triple-I figures drawn from ISO.
How big is the US roofing trade?
About 166,900 people worked as roofers in the US in 2025. That count comes from the Bureau of Labor Statistics, which projects 5 percent growth by 2035 (BLS).
| Statistic | Figure | Source and year |
|---|---|---|
| Roofers employed in the US | 166,900 | BLS Occupational Outlook Handbook, 2025 |
| Median annual pay | $55,440 | BLS Occupational Outlook Handbook, May 2025 |
| Projected employment growth | 5% | BLS Occupational Outlook Handbook, 2025 to 2035 |
| Projected job openings each year | About 12,000 | BLS Occupational Outlook Handbook, 2025 to 2035 average |
| Share employed by roofing contractors | 72% | BLS Occupational Outlook Handbook, 2025 |
| Share who are self-employed | 20% | BLS Occupational Outlook Handbook, 2025 |
| Private establishments, all specialty trade contractors (not roofing alone) | 597,918 | BLS Industries at a Glance, first quarter 2026 |
BLS counts workers here, and it does not count companies. Roofing has a high share of self-employed workers. One roofer in five is self-employed, against 72 percent who work for roofing contractors.
The last row is the only count of businesses in this table, and it is wider than the trade. BLS counts 597,918 private establishments across all specialty trade contractors (BLS Industries at a Glance). For how firm and establishment counts differ, see our post on US small business counts by market.
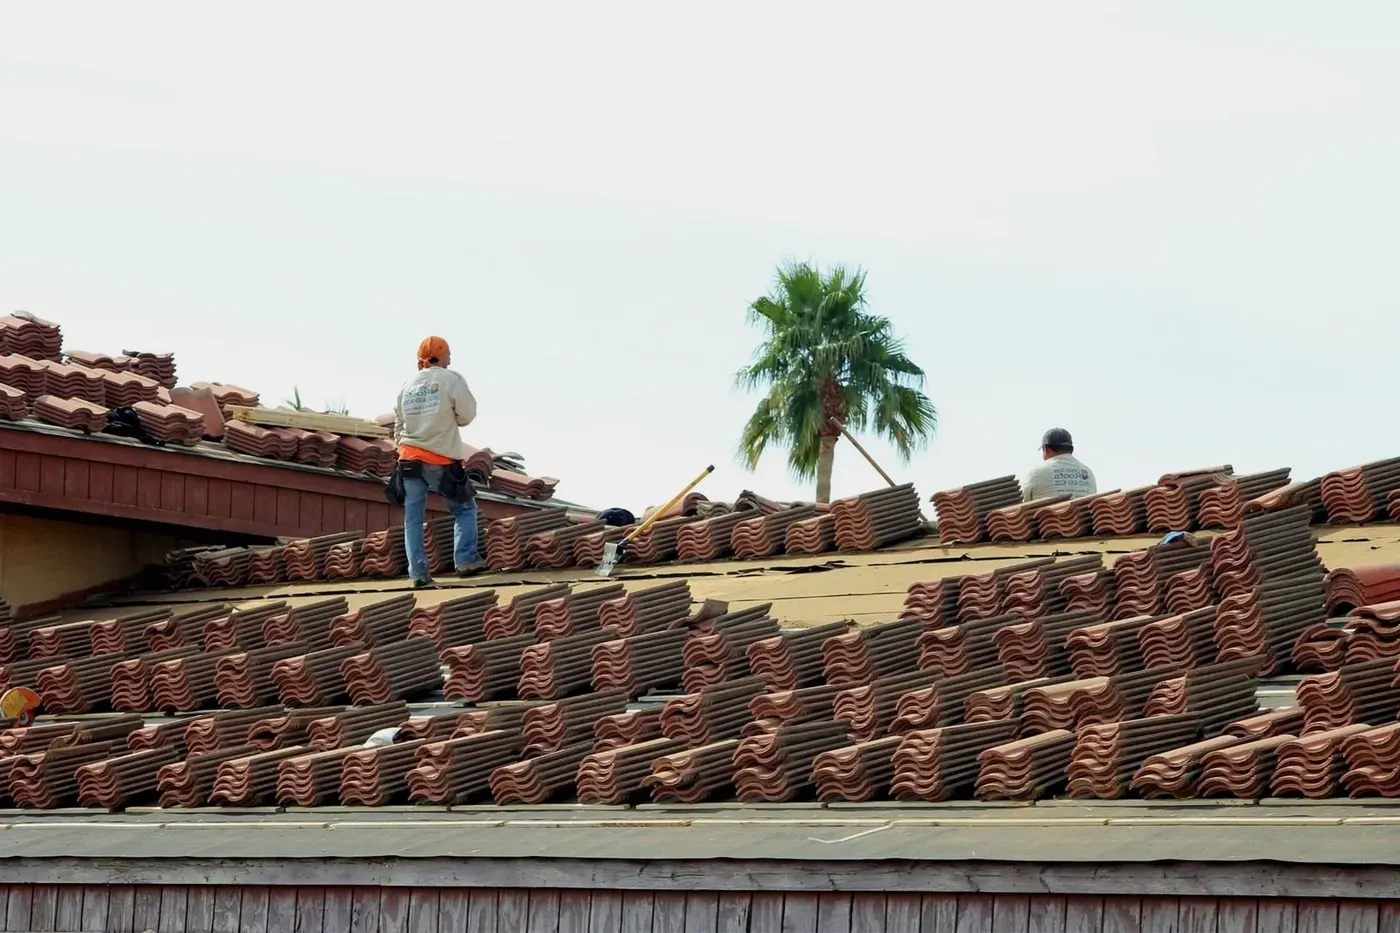
Photo: Jim McLain on Pexels.
How do customers find and choose a roofer?
They read reviews first. In the BrightLocal Local Consumer Review Survey 2026, 97 percent of US consumers said they read reviews for local businesses (BrightLocal). The survey used a panel of 1,002 US adults and was published in February 2026.
| Statistic | Figure | Source and year |
|---|---|---|
| Consumers who read reviews for local businesses | 97% | BrightLocal, 2026, US adults, all local businesses |
| Consumers who use Google for local business reviews and recommendations | 71% | BrightLocal, 2026, US adults, all local businesses |
| Consumers who use ChatGPT and other AI tools for the same job | 45% | BrightLocal, 2026, US adults, all local businesses |
| Consumers who will only use a business with four or more stars | 68% | BrightLocal, 2026, US adults, all local businesses |
| Consumers who will not use a business with fewer than 20 reviews | 47% | BrightLocal, 2026, US adults, all local businesses |
| Consumers who look for reviews written in the last three months | 74% | BrightLocal, 2026, US adults, all local businesses |
| Consumers who expect the owner to respond to reviews | 89% | BrightLocal, 2026, US adults, all local businesses |
These figures cover local businesses in general. They are not specific to roofing, and BrightLocal does not break them out by trade. We include them because a roofer is chosen the same way: a search, a rating and a few recent reviews.
Read the 20 review row with the three month row. A company with 200 old reviews can still fail the recency test. The local SEO for roofers page covers the profile and review work, and what local SEO costs in 2026 covers the price.
What do Google Ads cost for roofers?
Roofing and gutter advertisers paid a median $10.70 a click and $228.15 a lead (LocaliQ). That is the highest cost per lead of the 16 home services categories in the report.
| Statistic | Figure | Source and year |
|---|---|---|
| Click-through rate, roofing and gutters (median) | 5.66% | LocaliQ, 2025 report, US |
| Cost per click, roofing and gutters (median) | $10.70 | LocaliQ, 2025 report, US |
| Conversion rate, roofing and gutters (median) | 3.70% | LocaliQ, 2025 report, US |
| Cost per lead, roofing and gutters (median) | $228.15 | LocaliQ, 2025 report, US |
| Cost per lead, all home services (median) | $90.92 | LocaliQ, 2025 report, US |
| Home services businesses whose cost per lead rose year over year | 69% | LocaliQ, 2025 report, US |
The click is not what makes roofing expensive. Plumbing pays $10.49 a click in the same report, which is close. The gap is the conversion rate, the share of clicks that become a lead. Roofing’s 3.70 percent is about half the 7.33 percent median for all home services.
LocaliQ says the report covers 3,211 US search campaigns on Google Ads and Microsoft Ads. It also says its “averages” are medians, and that each category holds at least 103 campaigns. LocaliQ’s newer 2026 report for all industries puts the wider Home and Home Improvement category at $8.33 a click (LocaliQ).
For what a click costs across other industries, read how much Google Ads cost in 2026. The cost per lead benchmarks post explains why a cheap click can still mean an expensive lead. If paid search is your next step, the Google Ads for roofers page shows how we would set it up.
Photo: Clément Proust on Pexels.
What do customers pay, and when do they buy?
A large share of roof work follows weather, and the insurance figures show its size. Wind and hail made up 42.5 percent of US homeowners insurance losses in 2023 (Triple-I).
| Statistic | Figure | Source and year |
|---|---|---|
| Billion-dollar weather and climate disasters | 27 | NOAA NCEI, US, 2024 |
| Of those, severe storm events | 17 | NOAA NCEI, US, 2024 |
| Total cost of those 27 disasters | $182.7 billion | NOAA NCEI, US, 2024 |
| Hail events recorded | 5,432 (5,373 in 2024) | Triple-I, citing NOAA Storm Prediction Center, US, 2025 |
| Hail events in Texas, the highest state | 902 | Triple-I, citing NOAA Storm Prediction Center, 2025 |
| Wind and hail as a share of homeowners insurance losses | 42.5% | Triple-I, from ISO data, US, 2023 |
| Average wind and hail claim | $14,747 | Triple-I, from ISO data, US, 2019 to 2023 |
| Wind and hail claims per 100 insured house years | 2.80 | Triple-I, from ISO data, US, 2019 to 2023 |
| Median age of owned homes | 41 years | US Census Bureau, American Housing Survey, 2021 |
The NOAA figures are for 2024, the last full year in the release we opened (NOAA NCEI). NOAA ranked 2024 second for the number of billion-dollar disasters in a calendar year. The hail counts are NOAA Storm Prediction Center figures as published by Triple-I (Triple-I).
The average wind and hail claim is an insurance payout across all such claims. It is not the price of a new roof. The Census Bureau also reports that roof replacement was among the most common exterior projects in homes built before 1950 (Census Bureau). It gives no percentage for roofs alone, so we do not quote one.
What does this mean for your marketing?
This section is our reading of the figures above. It is Mavix’s view, and none of the sources says it.
The review figures point at the cheapest work first. If 47 percent of consumers skip a business with fewer than 20 reviews, a thin profile loses calls before any ad runs. Ask for a review after every completed job, and answer each one.
Paid search in this trade is costly because few clicks convert. At 3.70 percent, the landing page and the speed of the callback matter more than the bid. We would fix those before raising a budget. The roofing SEO work covers storm damage, insurance and material questions, where a click costs nothing.
Storm demand arrives in bursts and by region. Texas recorded 902 hail events in 2025. A roofer there needs pages and ads ready before the season, not written the week after a storm.
Put your own numbers into the lead generation calculator before setting a budget. The benchmark tells you what a lead costs across the trade. Your close rate and job value tell you what you can pay for one. Our marketing for roofing companies page sets out where we would start.
What these figures do not tell you
- The review figures are from a survey of 1,002 US adults about local businesses of every kind. BrightLocal does not publish a roofing breakdown.
- The Google Ads figures are medians from one company’s client campaigns. Your metro, your service mix and your landing page can put you well above or below them.
- The benchmark report is the 2025 edition. It covers campaigns that ran between April 2024 and March 2025, so prices may have moved since.
- The BLS establishment count covers every specialty trade contractor, from painters to concrete crews. It is a ceiling for the trade, and we do not quote a share.
- None of these sources measures how many jobs a marketing channel produces for a single company. Only your own call and form records can show that.
Last checked against the sources on 2026-10-02.
The bottom line
The roofing numbers describe a trade where a paid lead costs more than in any other home service, mostly because few clicks turn into enquiries. Published medians tell you the going rate. Your own records of calls, inspections and signed jobs tell you whether that rate works for your company.
Questions people ask about this
How many roofers are there in the US?
BLS counted 166,900 roofers in 2025. It projects 5 percent growth from 2025 to 2035, with about 12,000 openings a year. In 2025, 72 percent worked for roofing contractors and 20 percent were self-employed.
How much does a roofing lead cost on Google Ads?
The LocaliQ 2025 home services benchmarks put the median at $228.15 for roofing and gutters. That is the highest of the 16 categories in the report. It is a US median from campaigns that ran between April 2024 and March 2025.
Why are roofing leads so expensive?
Because few clicks become leads. Roofing and gutters paid a median $10.70 a click, which is close to plumbing. Its conversion rate was 3.70 percent, about half the 7.33 percent median for home services. Half the conversion rate means about twice the cost per lead.
How many reviews does a roofing company need?
No source gives a roofing figure. Across local businesses in general, 47 percent of US consumers told BrightLocal they will not use a business with fewer than 20 reviews. In the same 2026 survey, 74 percent look for reviews from the last three months, so recent reviews count as much as the total.
How much roof damage does hail cause?
No source we opened separates roof damage from other hail damage. Wind and hail together made up 42.5 percent of US homeowners insurance losses in 2023. The average wind and hail claim was $14,747 across 2019 to 2023, according to Triple-I figures drawn from ISO.
Which state has the most hail?
Texas recorded 902 hail events in 2025, the highest of any state. Kansas followed with 375 and Oklahoma with 369. These are NOAA Storm Prediction Center counts as published by the Insurance Information Institute.
Are these statistics specific to roofing?
The employment and Google Ads figures are. The storm and insurance figures cover all property damage, and the review figures cover local businesses of every kind. Each table row says which is which, so you can quote the right scope.
Sources for every number on this page
- Roofers, US Bureau of Labor Statistics, Occupational Outlook Handbook, 2025 data.
- Assessing the U.S. Climate in 2024, NOAA National Centers for Environmental Information.
- Facts and Statistics: Hail, Insurance Information Institute, citing NOAA Storm Prediction Center counts for 2024 and 2025.
- Facts and Statistics: Homeowners and renters insurance, Insurance Information Institute, ISO data for 2019 to 2023.
- Cost of Improving and Maintaining Older Homes Higher for New Owners, US Census Bureau, 12 October 2023, American Housing Survey 2021.
- Local Consumer Review Survey 2026, BrightLocal, published February 2026, 1,002 US adults.
- 2025 Search Ad Benchmarks for Home Services, LocaliQ, 3,211 US campaigns from April 2024 to March 2025.
- Search advertising benchmarks, 2026 edition, LocaliQ, Home and Home Improvement row.
- Specialty Trade Contractors: NAICS 238, US Bureau of Labor Statistics, Industries at a Glance, first quarter 2026 establishments.
Free review
Want this looked at on your own site?
Send the address. A person reads it and writes back with the two or three things that would move your enquiry number first. Free, and yours to keep whether you hire us or not.